


The price of Bitcoin has been in a stable consolidation for almost two weeks with no indication of directional bias.
However, the Non-Farm Payrolls (NFP) release on October 7 might provoke a dramatic event for BTC that could resolve the tightening of its trading range and establish a directional bias.
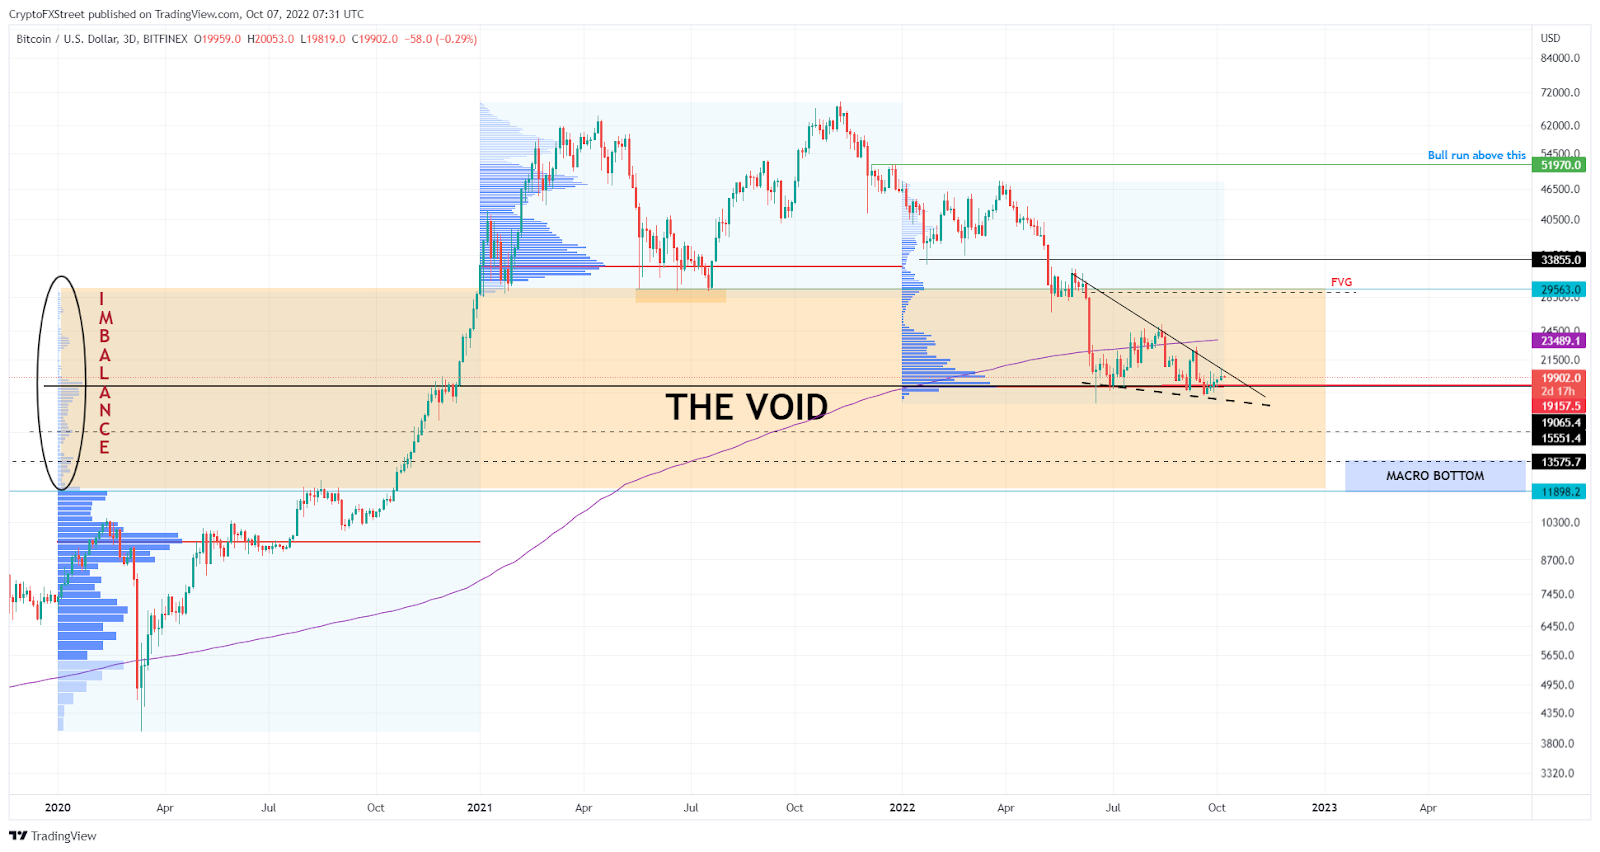
The price of Bitcoin continues above $19,157, the highest traded volume level for 2022, also known as the Point of Control (POC).
As stated in the preceding article, buyers are secure so long as BTC continues above the POC; however, a breakdown might result in a sharp fall to the next high-volume node around $15,551.
Beyond this support floor, there are two important levels around $13,575 and $11,995, where a macro bottom for BTC might occur.
This three-day chart for Bitcoin has not altered significantly, but investors should continue to monitor the POC at $19,157 and the immediate support level at $15,551.
The next significant chart is the eight-hour chart of Bitcoin price accompanied by the Relative Strength Index (RSI), which has precisely anticipated the creation of local tops and bottoms since May 30.
After a brief stabilization between the $18,000 and $19,000 levels, the price of Bitcoin soared over $20,400, and the RSI above the 43 to 46 level, turning it into a support level.
The rally that began here established a local peak at $20,500, while RSI formed its seventh peak at the 65 to 72 threshold.
 Wise Traders Best Choice - AssetsFX Wise Traders Best Choice - AssetsFX |
A deeper look at the Bitcoin price reveals the presence of a bear flag. As the name suggests, this technical formation features a flagpole, which was constructed when BTC fell 18% between September 12 and September 19.
The flag creation was the consequence of consolidation in the shape of a parallel ascending channel. Adding the height of the flagpole to the breakout point of $19,412 yields an 18% decline to $15,800 in the event of a breakdown of this technical pattern.
Moreover, the realized price of whales owning over 1,000 BTC is around $15,800. The realized price of these BTC is computed based on the volume going into and out of exchanges and the Bitcoin price at the moment.
This number fits precisely with the technical expectations, lending credibility to the prospect of a sharp fall to $15,800.
Despite the fact that the first perspective for Bitcoin price may appear bearish based on the preceding explanation, investors should view this likely drop to $15,800 as a chance to acquire BTC and altcoins at a discount.
A rise in purchasing pressure at this level that culminates in a U-turn might be the finest buying opportunity before the Bitcoin price begins a run-up to cover the $27,365 to $28,740 CME gap.
The Bitcoin price forms these gaps while the Chicago Mercantile Exchange (CME) suspends trading over the weekend.
Consequently, a rebalancing of these inefficiencies may be another important factor that prompts a reversal at $15,800.
Alternatively, if selling pressure continues to develop on the basis of escalating geopolitical tensions and worse economic conditions, the price of Bitcoin might plummet to $15,800 and never recover.
If this decline causes BTC to convert the $15,551 support level into a barrier of resistance, the preceding bullish thesis would be invalidated.
In such a scenario, market investors could anticipate a possible decline to $13,575 and $11,989.
|
HOT TOPICS |
|
|
Elon Musk Presents The Humanoid Robot "Optimus" At Tesla's AI Day |
|
 |
|
 |